Maximizing Success: Top 5 Metrics Every B2B SaaS Marketer Must Know
Adaptability and farsightedness are the drivers of success in B2B SaaS. By tracking the right metrics, marketers succeed in finding a success compass. The compass would guide them through all the complexities of long sales cycles. An organization’s value indicators reflect its experience and strategic competence.
However, nowhere is this more crucial than in the world of those B2B tech companies struggling with long sales cycles. In these companies, one day beyond 45 days requires an intricate and precise roadmap for financial planning.
The stakes are high enough when responding to ticket prices reaching $30K. This justifies a precision and strategy that goes beyond the usual rules.
This blog will explore the nuances of success in B2B SaaS marketing. It will reveal 5 irreplaceable metrics. The metrics help in data-driven decision-making in B2B SaaS marketing success.
Segment 1: Sales Cycle Length
The length of the sales cycle is a crucial metric. This is so when working with long-term contracts. This kind of metric is a power indicator. It reveals how long an average lead takes to travel along the sales funnel and become a paying customer.

Knowing and streamlining this period could increase the efficiency of marketing efforts. This, in return, would lead to a much more organized customer conversion process. To find the average sales cycle length, use the formula:
This formula represents a summary of the first touch-to-last touch model. It encompasses the time between initial contact with a lead and the final culmination of the purchase. Hence, it provides an in-depth account of the pilgrim’s voyage.
Segment 2: Lead Velocity Rate (LVR)
The penetration of new leads into the sales funnel is critical for success. The Lead Velocity Rate (LVR) provides an in-depth overview of how your sales pipeline grows. It also provides the overall state of the sales pipeline. The formula for calculating Lead Velocity Rate is as follows:

This formula specifies the number of new leads entering the sales funnel daily. Comprehension of LVR gives quantity leads and also covers quality engagement. Being able to convert leads from cold prospects to actively engaging is important. It shows how well the entire marketing program works.
Segment 3: Pipeline Coverage Ratio
The Pipeline Coverage Ratio is essential to mapping sales pipelines with revenue objectives. This ratio is a magnifying glass for marketers. It helps them assess their sales prospects against the company’s revenue goal. The formula for calculating the Pipeline Coverage Ratio is simple:
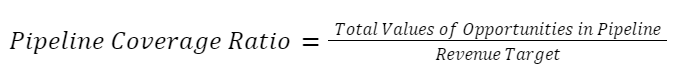
A ratio of one and above indicates a healthy pipeline. This means your opportunities are good to meet or exceed the revenue objectives.
Why is this metric essential? Time decays opportunities in a pipeline, which may get lost with age. Often, injecting new opportunities into the pipeline becomes necessary. This is because not every lead is ready to buy at a given time. Pipeline Coverage Ratio is important in predicting and balancing sales and marketing objectives. Thereby encouraging strategic action to maintain a healthy pipeline.
Segment 4: Customer Acquisition Cost (CAC) Payback Period
The CAC Payback operates like a financial compass. It enables marketers to evaluate the attractiveness of acquiring new customers. The formula for calculating the CAC Payback Period is straightforward:

This formula measures the rate of money spent on acquiring a customer returns to your firm. The buy stock and wait for the investment to come back analogy is appropriate. This is so when knowing what your expense of acquiring each customer will be recouped.
For start-ups getting references, the CAC Payback Period becomes a golden metric. It acts as an economic life vest worth preserving by any means necessary. This measure indicates the financial efficiency of customer acquisition and provides a strategic view through which companies can hone their approach to improve returns in less time.
Segment 5: Customer Lifetime Value (CLTV) to CAC Ratio
This measurement gauges where the customer’s lifetime value in revenue is placed against what it costs to acquire that same client. It considers potential revenue and the costs of serving such customers. The formula for calculating the CLTV to CAC Ratio is given by:
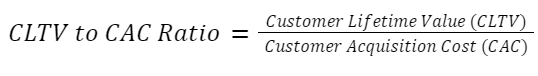
This serves as a measurement of success in the marketing world. If your ratio is higher, it means that you are doing better at maximizing returns from every cost spent on acquisition.
Although the best case is to look into a customer’s lifetime profit over their history, many companies rely on revenue numbers for convenience. The second part of the ratio allows marketers to compare costs and revenue. The treasure generated from an investment in each customer.
If the CLTV to CAC Ratio is more than 1, this means positive ROI and long-term profitable customer acquisition. Thus, through regular tracking and improving this metric by B2B SaaS, marketers can make decisions to improve effectiveness and efficiency in their customer acquisition plans.
And to Conclude
B2B SaaS marketing involves accuracy, approach, and pinpoint focus on vital metrics. This is why the five critical metrics allow us to offer a data-oriented guide for marketers. The Sales Cycle Length provides information on the customer journeys.
The Lead Velocity Rate (LVR) measures lead influx quality/quantity. The pipeline coverage ratio bridges sales prospects with revenue targets. The CAC payback period acts as an integral financial compass for bootstrapped firms. The CLTV to CAC Ratio balances potential expected revenue and cost of acquisition.
This is a positive sign for long-term earnings. These metrics allow B2B SaaS marketers to navigate extended sales cycles strategically. They reveal the mysteries of winning businesses within this complex setting.